


“Stop Watching the Crystal Ball”.
.
What is A/B Split Testing?
Let’s start with a few terms. A nice glossary from our friends at Dynamic Yield can be found here.
What is A/B split testing? In general, it’s a controlled experiment for website owners to understand and improve the user experience (UX). Website owners run so-called experiments, testing a baseline (“A”) against a variation (“B”). The split test focuses on a specific hypothesis and aims to reach a certain goal. As a marketer, the goal is typically to determine the best-performing variant, increase conversions for their brand site, improve interactions with their community, or get more newsletter sign-ups.
The test framework randomly adjusts the delivery of an email, banner ad or landing page to show either version A or B to the user. Usually, each content variable (A and B) has a weight assigned that should sum to 1. Classically, a standard test uses a 50-50 split, meaning the test framework renders the baseline variation around 50% of the time and a different version around 50% of the time.
However, marketing can also adjust the weight for more specific needs. Since the assignment is random, a perfect 50-50 split won’t be achieved at all times during the experiment. It fluctuates but will settle eventually around the expected weight distribution. Remember the coin-flip experiment back in school? You usually don’t end up with heads, tails, heads, tails, heads, tails, etc. Instead, you have heads, heads, heads, tails, heads, tails, tails, heads, etc. Statistically, over time, you will get closer and closer to an even 50-50 split.
AB Testing 1
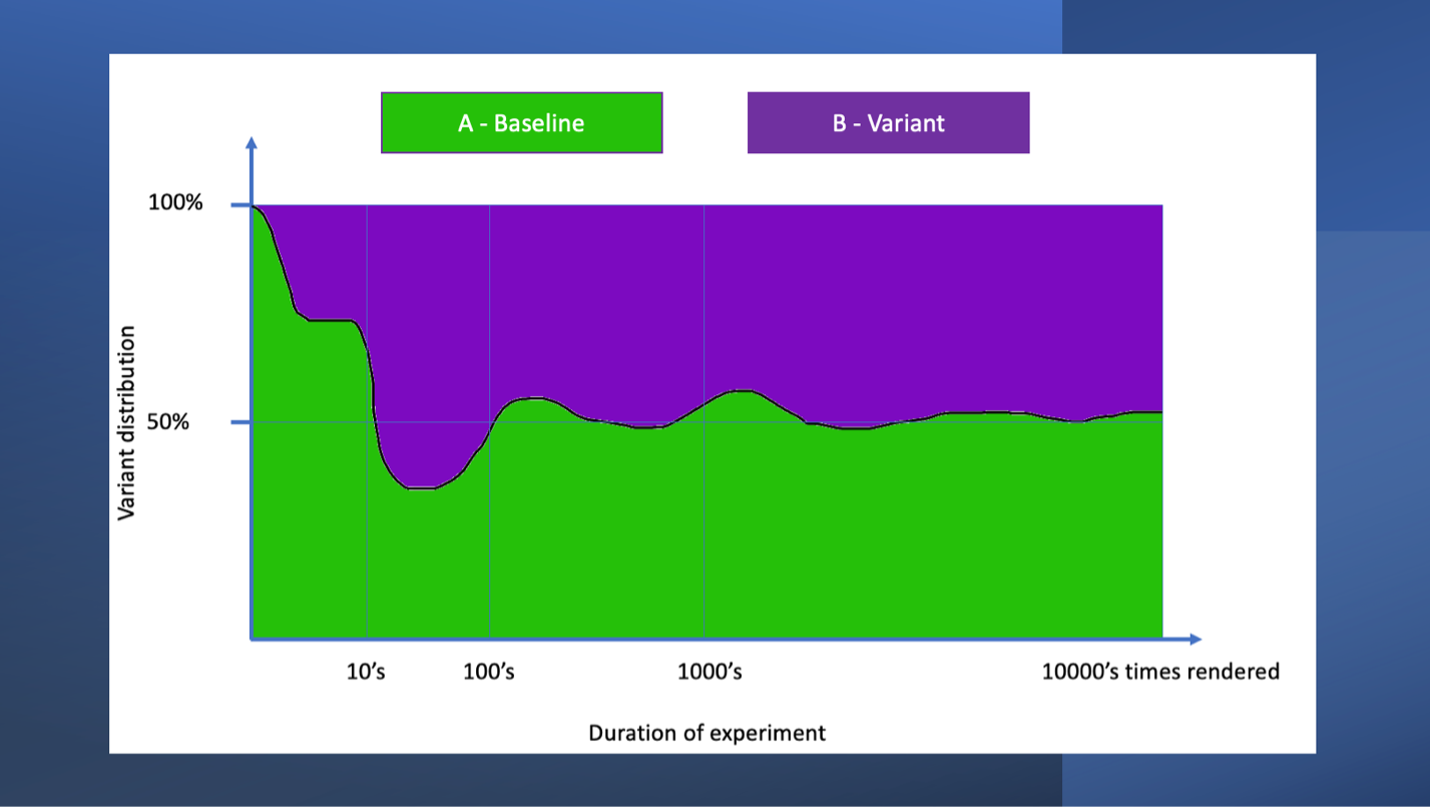
Figure 1: Randomly assigned variations are not a perfect split throughout the whole experiment but will level to the allocated weight distribution over time.
Another option is multivariate testing. These are called B1, B2, B3, and so on, and in this case, the split test is called an “A/B/n Test”. Just like an A/B split test, an A/B/n test focuses on one specific content piece and - even more important - on one hypothesis.
What to Test?
A test should focus on a specific hypothesis. A simple question like: “How likely is it that variant B of my product page will get more clicks than my baseline A?” To get to this question, start with the overall goal and determine what metrics you would like to optimize.
For example, your big goal could be to boost your conversion rate so customers buy more of your products. Other examples could be “I want high-traffic levels for the new design of my landing page” or “I want my employees to read my important news in the intranet portal as quickly as possible” – it doesn’t always have to be focused on retail or conversion metrics. Next, think about how to achieve that. To stick with the example above, you might want to optimize how often your customers visit the Product Detail Page (PDP) and read about your product, thinking this will increase conversion rates. That is your hypothesis! An assumption.
Based on this, you determine more specifically what exactly will provide the desired outcome. For example, you could experiment with multiple variations of a banner pointing to your product. Or try different images on your web page. Or try an animated image vs. a static image. Test different page elements, claims, and different call-to-action (CTA) labels. There are so many possible combinations that could lead you to the desired outcome. Picking something to start the process is the hardest because you want to test different versions that have a chance to make a difference. But for a beginner, it’s hard to determine what exactly is the issue. So, as a recommendation, first start with a small split test as you familiarize yourself with multivariate testing. Over time, the analytics will show what changes have a higher chance of impact. Also, don’t try everything at once - start with small changes, make yourself familiar with the procedure, learn, find a good length or test count for your audience, and understand how to read the results first. It’s about establishing a sound testing program, getting experience, and then expanding your proficiency over time.
Duration of a Split Test
Another important aspect – take your time and give your users time as well. Don’t finish your test after only a short period of time. And even worse, don’t finish testing early! Consider your audience and when and how often your visitors see the variations. Remember the last election? Early results seemed to hint at one winner, but in the end, the opponent won. This usually happens because there are groups of people who vote early in the day while others have to go to work first and vote in the evening. Or some voted by mail – whereby these votes were counted already or together with the votes from in-person voters.
Whatever the reason is, similar variables might be true for your audience! Maybe some customers visit your landing page repeatedly during the week, others only on the weekend. Maybe some use your services early in the month, some at the end of the month. Typically, you have already identified customer segments that include these kinds of behavioral attributes. Make sure that your test period is long enough to give all your customer segments a chance to become a tester. If you can’t wait that long, consider these effects when analyzing the results. Don’t shy away from a test period of 2-4 weeks or longer. However, if you don’t have the time - e.g., if you test for a news magazine or something similarly fast-paced
Measure the Results and Draw Conclusions
In the end, you want to measure the impact the change has. Your analytics framework is key to making the actual measurements. How often was the call-to-action button clicked? How often did the user spend more than 10 seconds on the PDP? How many users scrolled below the fold? How many actually purchased the item? Did your conversion rate go up...or down? It is data galore!!!!
Interpreting the collected data is one of the trickiest aspects of split testing. All the experiments are for nothing if you can’t conclude anything. Always go back to your detailed hypothesis. Did it turn out to be true or false? Don’t be afraid to say the hypothesis was wrong. That doesn’t mean your split test failed. Quite the opposite! You learned that the change that was tested had an impact. It means, for the next test, you will use a different lever to reach your goal.
So, what is an outcome of the test that can be identified as a true result? Instinctively, you might say “A higher click-through rate for one variation defines a clear winner, right?” And yes, if your split test is set up properly, this might be true! But what if the baseline and the variation have the same click-through rate (CTR), does it mean they are equally good? Well maybe! Consider this: both banners have the same CTR, the users reach the PDP landing page at almost the same rate. But what now? Your goal is to increase conversions. Potentially, users who saw and clicked the variant might not purchase the actual product compared to the baseline users. Maybe they clicked on the fancy CTA button out of curiosity or reflex, compared to the baseline users who were truly interested in the product. So, your first measure - the click-through rate - looked about the same, but mixing in the second measure – the actual number of conversions – gives you the actual winner!
AB Testing 2
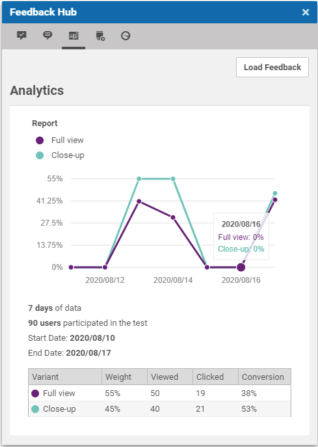
Built-in feedback for click-through rates with CoreMedia Content Cloud Experience Feedback Hub - directly integrated into the editorial interface for immediate feedback to the content creator.
Figure 2: Built-in feedback for click-through rates with CoreMedia Content Cloud Experience Feedback Hub - directly integrated into the editorial interface for immediate feedback to the content creator.
By randomly assigning the baseline and the variant options, you have a good chance of getting a fair result for each variant tested. If you dig a bit deeper, there is a lot more to consider regarding the test, the interpretation of the metrics, and optimization. For example, is the random test really evenly distributed across the different customer segments? What if you split test a banner using female vs. male models for a unisex product? But your customer base is 80% female, and only 20% male. If the teaser with the female model has a higher click-through rate, it can also be tied to a disproportionally high female conversion rate. At the same time, you might lose a few of your male buyers. You might want to think about further optimizations, such as personalizing your content and showing the female model banner version to your female customers, and your male model version to your male customers.
Have I mentioned that reading the results is the hardest part? Don’t get frustrated! Over time, you will gain experience and you and your Marketing team will optimize what to test and what to measure to come to actual comparable results. Allow yourself and the team time to learn!
What is Multivariate Testing?
You noticed how quickly “simple” A/B tests and their interpretation can get complex. We focused on one change on one item, but what about changing multiple variations at the same time? Let me introduce you to “multivariate testing”. Here, the test doesn’t focus on one piece of content in different variations, but rather multiple pieces that are tested together – still working towards one goal. For example, while you might test a banner as a simple A/B test in two different rendering variants or two different CTA labels, multivariate testing would consider this banner and two other banners visible on the same page or other pages. Multivariate tests are more complex and the results even more complicated for marketers to understand – which one of the changes truly impacted the results? Also, here read a bit more about the complex nature of multivariate tests. I recommend tackling the multivariate test approach after you are fully comfortable with classic A/B split testing and ready to build upon the knowledge you gained with those.
Getting Comfortable with A/B Split Testing
There is only one way to get proficient with the topic of A/B split testing: learning step by step! Maybe you could run your first test as an A/A test. Wait! What? A + A… Baseline and Baseline? Would that help anyone? It has a few advantages, such as a starting simple and an uncomplicated way to familiarize yourself with testing procedures. But it also allows you to test your A/B testing program. Does the random distribution of the variations work properly? Is my analytics framework measuring properly? Next to the simple fact that it helps you get used to the testing process, it validates your testing methods. This is especially recommended if you introduce a new tool or framework.
Furthermore, how about the procedure itself? How long do you need to run the tests? How many clicks, how many weeks? Remember the fluctuation I described above about the random distribution of your many variations? You can experience similar effects with the actual behavior of your users. A lot of experts recommend “No peeking!” during the tests. That means: Be patient! Wait for the full experiment to be finished before starting to analyze the results. The point is to not conclude too early. Remember my examples from above? It’s a common error to see a clear leader at a certain time in the test who then ends up being the loser at the end.
In my opinion, if you are new to A/B testing, go ahead and peek, but don’t interfere! Peeking can give you the chance to learn a few things along the journey. For example, you can see how the variations “race to the finish line”. Maybe that helps you understand your audience better. Maybe you can identify patterns for different customer segments or versions of a page. Data-driven information that helps you understand your customers better will help you in your ultimate decision-making, even if it doesn’t influence the specific test at hand.
Conclusion and More Advanced Considerations
There is a lot more to say about A/B split testing: more terms, more things to consider, more things to optimize, more possibilities! We recommend taking a look at how behavioral analytics can influence the customer experience.
Our partners at Dynamic Yield are experts in that field and are happy to share further insights and their deep knowledge. For example, have a look at their very detailed and comprehensive A/B Testing & Optimization Course. The course explains all the aspects, all the things to consider, the various types of tests, how to read the results, and so much more!
And of course, CoreMedia Content Cloud can integrate with A/B/n split testing and personalization engines such as Dynamic Yield. Even if you’re a beginner in A/B testing, give CoreMedia Content Cloud and our out-of-the-box capabilities a try. If you are an advanced tester or even an expert, have a look at these testing and personalization engines – knowing you can integrate these with CoreMedia Content Cloud as your best-in-breed CMS, as well!
If you are interested in an in-depth demo on how marketers can work with CoreMedia and A/B/n testing, please contact us. I look forward to speaking with you!